The MT4 Exit Manager (MT4 EM) includes an easy-to-use desktop application interface for creating simple to very sophisticated exit strategies and trade management. This tutorial covers various topics, methods, and applications for strategy development, focusing on the importance of risk management, trade allocation, and exit strategies using MT4 EM’s built-in function set.
Dynamic Money Manager
Strategy Principles
The functions included with MT4 EM provide opportunities to quickly correct the direction of a losing position, adjust trade size, and bring break-even points closer, within a realistic range to gain profits faster, all while keeping risk as low as possible. The topics covered in this tutorial will bring theory to life regarding strategy development with the MT4 Exit Manager Desktop Application.
MT4 Exit Manager - Functions Tab
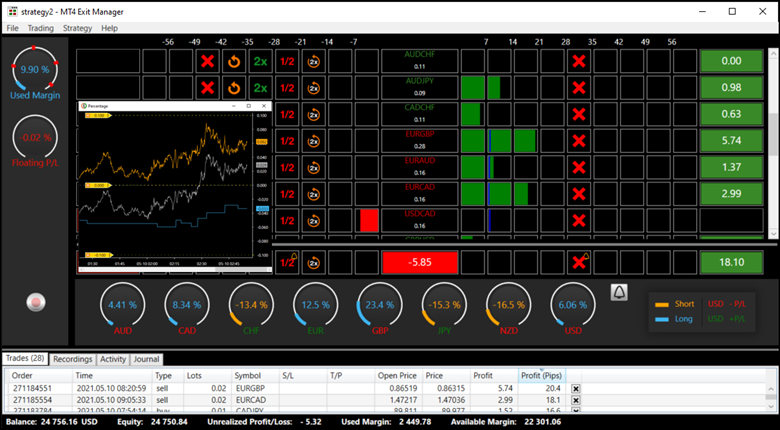
EURUSDJPY Triad - A Basket Strategy
First, become familiar with a simple strategy, watch it trade in real-time, and observe its behavior. An appreciation of function actions, results, and their impact on trading styles become realized.
This Strategy will use a typical basket including; EURUSD, EURJPY, and the USDJPY. The basket is selected due to the usual negative correlation between the EURUSD and USDJPY while using the EURJPY as a balancing tool between the three currency pairs.
A negative correlation occurs when currency pairs move in opposite directions with relative distances. A 100% negative correlation is present if, for every pip increase in the defined time period for the EURUSD, the USDJPY moved exactly one pip down. The opposite is true regarding positive correlations.
Pair selections for various baskets are created based on correlation principles and their respective daily ranges.
Inside the DMM Window > Functions Tab, add the functions and specified parameters as they appear in the image on the right.
This Strategy uses seven pips as the grid size. It also assumes a demo account of at least $2,500 and that it will trade only three currency pairs; EURUSD, EURJPY, and USDJPY. There will be no restarting parameters for simplicity while testing a base strategy.
Dynamic Money Manager - Functions Tab
Functions are set to occur twice at the -14 pip level using the double-reverse function with subsequent functions created at the -21 pip and further grids. Half-reverse functions are made to free up the Margin and keep the pip level to a controlled maximum. If the pip level grows too much, the Risk Management setting for the Max Pip level is capped at 10.00 USD.
Note the remaining Risk Management settings for this Strategy in the bottom section of the DMM Window.
Timed Trades Tab
The Timed Trades Tab creates entries at 02:00 EST. Entering around the time of the London Session open when volatility usually increases. Copy the parameters as they appear in the image on the right.
Note that the Start Recording and Open Positions at boxes are both checked. Also, pay attention to the Buy/Sell directions set for the three currency pairs are selected to complement correlation characteristics as previously described. After choosing the desired parameters, click the OK button. When 02:00 arrives for the specified date, trades are automatically created, and the strategy functions are applied.
Dynamic Money Manager - Timed Trades Tab
Strategy Monitoring and Manual Adjustments
The Strategy and its functions are created to run automatically and with little to no manual management. However, if the Used Margin is higher than expected, i.e.,> 75%, it may be necessary to close some positions earlier. In this case, the best positions to close are those with high pip values beyond their Break-Even Marker.
Key Values
Pip Value – center column under each currency pair
Used Margin – gauge in the upper left of the application
Break-Even Markers – vertical blue lines in the respective grid appear after a function on the negative side, i.e., double-reverse triggers. It is the distance necessary to reach a P/L of $0.00.
Break-Even Marker
P/L Graph
Open the P/L Graph via the Trading > Balance Graph menu sequence or using the keyboard shortcut Alt + B.
Right-Click Options
The P/L Graph may be set to show percentages or dollar amounts.
Alerts are added directly to the graph and are draggable to new locations.
Legend
Gold Line – Floating P/L
Grey Line – Equity
Blue Line – Relative Balance
Scroll over the chart to see a popup of the above values.